Ansible Tower has a nifty little feature that allows us to spit off its logs from playbook runs in real time to a log aggregator. Typically this would be something like Splunk or Elastic Stack. I on the other hand wanted to utilize the data for my own needs. In particular I was wanting all the fact data for a reporting engine I was creating. I typically use PHP to rapidly prototype projects, as I can write it super fast, and then go back and rewrite projects that proved interesting, in python.
So I created a RHEL 8 VM to start testing on. First thing I needed to do was to create a ‘server’ in nginx listening on a port besides 80/443, since my reporting website would be running on those ports. I chose port 5000 as that seems to be the default for a few of the other log aggregation products. I wanted to encrypt the data stream, so I created SSL certificates, etc.. to run with it. I am using all self-signed certs but you can give it a real cert if you want. If using self-signed, be sure to disable the certificate check in Ansible Tower. If you don’t want to use SSL, you will have to explicitly put a http:// in front of the server name in Ansible Tower.
What you will mainly notice that is different in this config is that I set the index to parse.php which is the script I wrote to parse the output. So all output to this port is parsed by my script by default.
server {
        listen 5000 http2 ssl;

        server_name _;
        root /opt/app/html;


        ssl_certificate /etc/ssl/certs/nginx-selfsigned.crt;
        ssl_certificate_key /etc/ssl/private/nginx-selfsigned.key;
        ssl_dhparam /etc/ssl/certs/dhparam.pem;

        ssl_protocols TLSv1 TLSv1.1 TLSv1.2;
        ssl_prefer_server_ciphers on;
        ssl_ciphers "EECDH+AESGCM:EDH+AESGCM:AES256+EECDH:AES256+EDH";
        ssl_ecdh_curve secp384r1;
        ssl_session_cache shared:SSL:10m;
        ssl_session_tickets off;
        ssl_stapling on;
        ssl_stapling_verify on;
        resolver 8.8.8.8 8.8.4.4 valid=300s;
        resolver_timeout 5s;

        # Disable preloading HSTS for now.  You can use the commented out header line that includes
        # the "preload" directive if you understand the implications.
        #add_header Strict-Transport-Security "max-age=63072000; includeSubdomains; preload";
        add_header Strict-Transport-Security "max-age=63072000; includeSubdomains";
        add_header X-Frame-Options DENY;
        add_header X-Content-Type-Options nosniff;

        access_log  /opt/app/logs/parse-access.log  main;
        error_log   /opt/app/logs/parse-error.log;

        location / {
                index parse.php;
        }

        location ~ \.php$ {
                fastcgi_pass 127.0.0.1:9000;
                fastcgi_index index.php;
                fastcgi_param SCRIPT_FILENAME $document_root$fastcgi_script_name;
                include fastcgi_params;
        }
}
The next thing I did was create my parse.php. Absolutely everything that happens in Ansible Tower is sent off to this script. You can easily grab this data via the PHP Input Stream. This data is json, and it can be in a slightly different format depending on logging aggregator type. I just set it to other.
Now lots and lots of data will be sent to this. If you find that your parser server is getting hammered badly, you can limit what Tower will send to this server by modifying the parameter “LOGGERS SENDING DATA TO LOG AGGREGATOR FORM“. We are looking for the job_events in particular for my use case.
You will find a quick sample of the PHP code below. There are some pieces I left out, such as my functions for storing the data, etc.. but this gives you the general idea.
- We grab the data from the Input Stream and check to make sure its not blank just for good measure.
- Next we attempt to decode the json data into an array we can use. If this fails (not valid json) then we want to exit cleanly.
- Now that we have an array of data, we want to look for a few key pieces. Namely we want to see if this is a job_event, so we check the logger_name field to see where it came from.
- If this matches “awx.analytics.job_events” then we will want to do a little more validation to ensure its the right type of job event, specifically the data from tasks ran against hosts. I noticed that the host_name field is always present for the data I wanted (since I want the fact data from hosts). So we look for that.
- Lastly, we grab the facts from the stream and parse them out into a usable format. From here you can do whatever you want with the data. I stuck it all in a MySQL DB so that I can create reports off of it.
<?php

$data = file_get_contents('php://input');
if ($data != '') {
	try {
		$data = json_decode($data, true);
	} catch (Exception $e) {
		exit;
	}
} else {
	exit;
}

if (isset($data['logger_name'])) {
	switch ($data['logger_name']) {
		case 'awx.analytics.job_events':
			if (isset($data['event_data']['res']['ansible_facts'])) {
				if (isset($data['host_name'])) {
					$f = $data['event_data']['res']['ansible_facts'];
					$t = $data['event_data']['task_action'];
					$fs = parse_facts($f);
					if (count($fs)) {
						// INSERT FACTS INTO DB HERE
					}
				}
			}
			break;
	}
}
function parse_facts($f, $fs = array(), $n = '') {
	foreach ($f as $k => $v) {
		if (is_array($v)) {
			$s = ($n != '' && substr($n, -1, 1) != '.' ? '.' : '');
			$fs = parse_facts($v, $fs, "$n$s$k.");
		} else {
			$fs[$n . $k] = $v;
		}
	}
	return $fs;
}
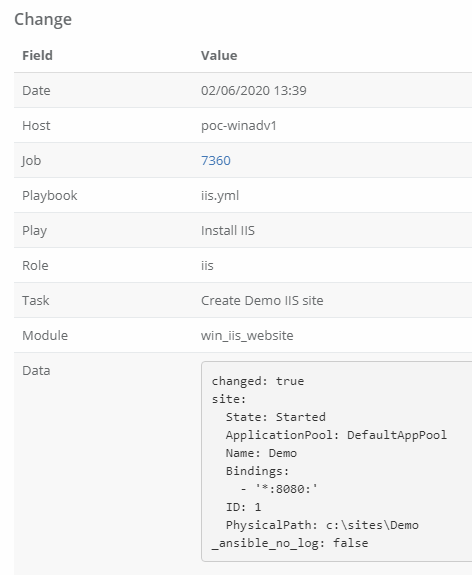
Now that you have the ability to process the data from Ansible Tower, there are a lot of neat things that you can do with it. Another function I wrote into my Reporting Engine is a change logger. Tower records every job run, but its not easy just to check and see everything that has changed across all your servers. So I record all these changes myself and present them in an easy to view format. I also allow searching of this data, so I can easily see which playbook has changed a particular file with just a few key presses.
In my demo Reporting Engine, an example view of all changes looks a little like this.

You can then view the individual changes with pertinent data about the playbook that made the change (and a link back the Ansible Tower log for that change). One thing to note, I convert the json results data to yaml for easier viewing / searching using Spyc.

